Hello! I have questions for you dear friends! Today i have been doing in my server by your guide (arcticle) Grafana for my Jitsi Meet instance. Almost all works fine but i have questions. When i done step by step by your article, in my Grafana dashboard looks like this: 

I’m using your’s template but other data is’nt working in my grafana dashboard. Can you please help me? I want to make like you did in this photo:

Can you help me do like this too? Waiting for your reply!
Hi,
no screenshot visible, but in your mail I see „No data“.
Which jitsi meet exporter do you use? Is there any kind of error in your logs ?
Greetings
Hello! No kind of errors, i used your grafana jitsi template all done by your guide and the result is „No data“
please try to ping your instance and check your user credentials. If you are able to ping your prosody instance from your exporter container send me your config files.
docker exec -it --user root jitsi-prom-exporter_jitsi-exporter_1 sh
/ # ping jitsi-meet_prosody_1
PING jitsi-meet_prosody_1 (10.0.1.108): 56 data bytes
64 bytes from 10.0.1.108: seq=0 ttl=64 time=0.068 ms
64 bytes from 10.0.1.108: seq=1 ttl=64 time=0.075 ms
^C
I can ping my server. Sending you my config files:
 - etc/jitsi/videobridge/config
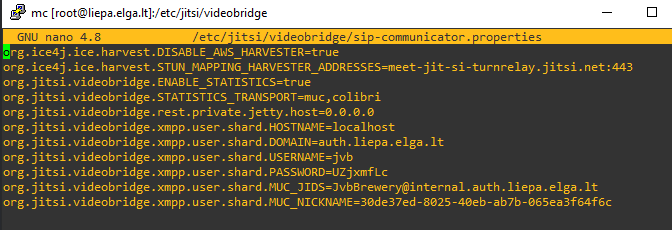
- /etc/jitsi/videobridge/sip-communicator.properties
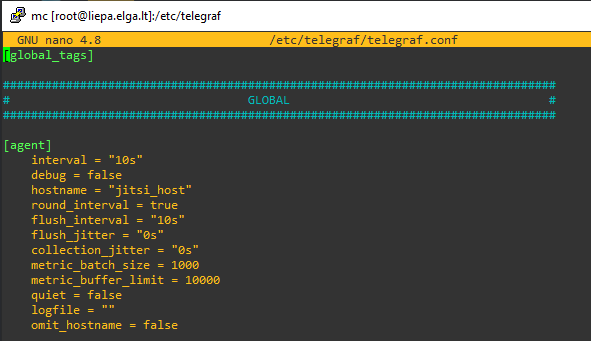
- /etc/telegraf/telegraf.conf
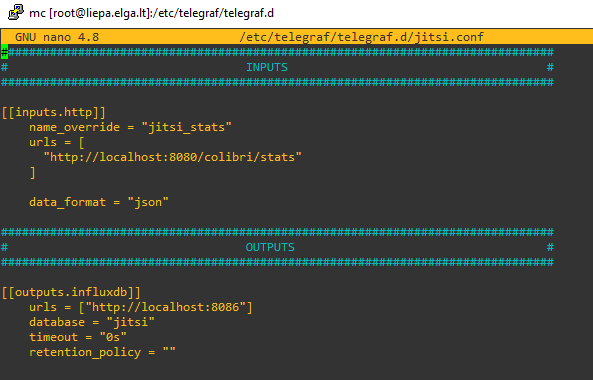
- /etc/telegraf/telegraf.d/jitsi.conf
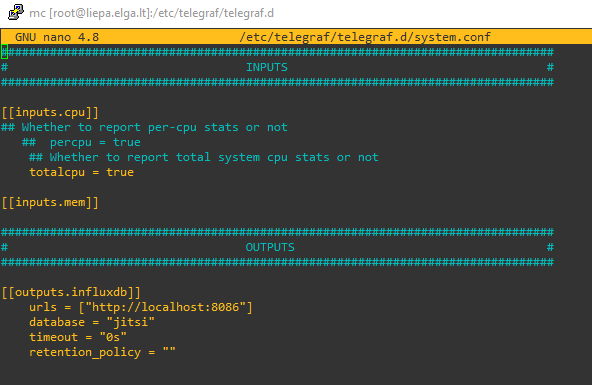
- /etc/telegraf/telegraf.d/system.conf
That’s my files
mhh which tutorial did you use?
I do not use telegraf → Jitsi Meet Grafana Statistiken (Docker) - adminForge
i used this one tutorial, because my version is not docker:
but i don’t know why the „data“ doesn’t work in grafana …
sorry my exp in telegraf is 0
But if i will do by your guide? or it’s important to have a docker to do by your guide?
the difference comes with prometheus, not docker
hm… and what’s better ? prometheus or telegraf?